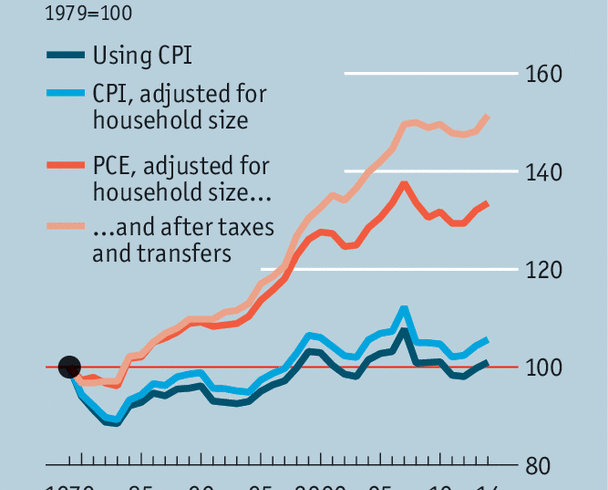
JUST how bad have the past four decades been for ordinary Americans? One much-cited figure suggests they have been pretty bad. The Census Bureau estimates that for the median household, halfway along the distribution, income has barely grown in real terms since 1979. But a recent report by the Congressional Budget Office (CBO), a non-partisan think-tank, gives a cheerier rise of 51% for median household income between 1979 and 2014. Which is nearer to reality?

The gap between the two is accounted for by three methodological differences (see chart). First, the CBO takes demography into account. This seems sensible: more Americans are living alone and American women are having fewer children, so households have fewer mouths to feed.
The second is that the CBO uses the personal-consumption expenditures (PCE) index to measure inflation, whereas the Census Bureau uses the consumer-price index (CPI). These differ in two main ways. The CPI includes only what consumers spend on themselves, whereas the PCE index also includes expenditures on their behalf, such as employee health insurance. And the CPI’s basket of goods is updated every two years, whereas that for the PCE index is updated quarterly. This means it is quicker to pick up substitutions: as the price of one item (apples, say) rises, consumers seek cheaper alternatives (for example, pears).
In 2000 the Federal Reserve’s rate-setting body switched from the CPI to the PCE index for its inflation target, citing this reason. Growth in the PCE index has generally been half a percentage point below the CPI. The gap, small in the short run, grows wider with each passing year.
The third difference is that the Census Bureau uses pre-tax incomes, whereas the CBO takes taxes and transfers, such as government-funded health insurance, into account. Between 1979 and 2014 the average federal tax rate for families in the middle fifth of the pre-tax income distribution fell from 19% to 14%. Transfers rose from 0.8% of pre-tax income to 4.7%.
Other data also suggest that the CBO’s methods paint a fairer picture. Bruce Sacerdote of Dartmouth College has calculated that household expenditure, converted to 2015 dollars using the CPI, has risen by 32% since 1972. Spending on food and clothing has fallen from 27% of the total to 16% in 2016, and the share spent on health care and housing has stayed roughly constant. That means more left over for luxuries. Homes have got bigger, and the number of cars per household has risen from 1 to 1.6.
The past four decades have been hard for many Americans. Trade and technology have upended the labour market, and many low-skilled men have left the workforce. Economic growth has been weak in non-coastal states, and the top few percent take home a greater share of all income. Wage growth, by any measure, has been far lower than in the post-war decades. But the idea that the typical American is little better off than four decades ago does not withstand scrutiny.